Read your PTE Academic result in two passes: check the overall and four skill scores against your requirement, then use the Skills Profile to plan practice. Do not average the numbers, turn a profile bar into an exact question score, or assume that a high overall result covers a weaker required skill.
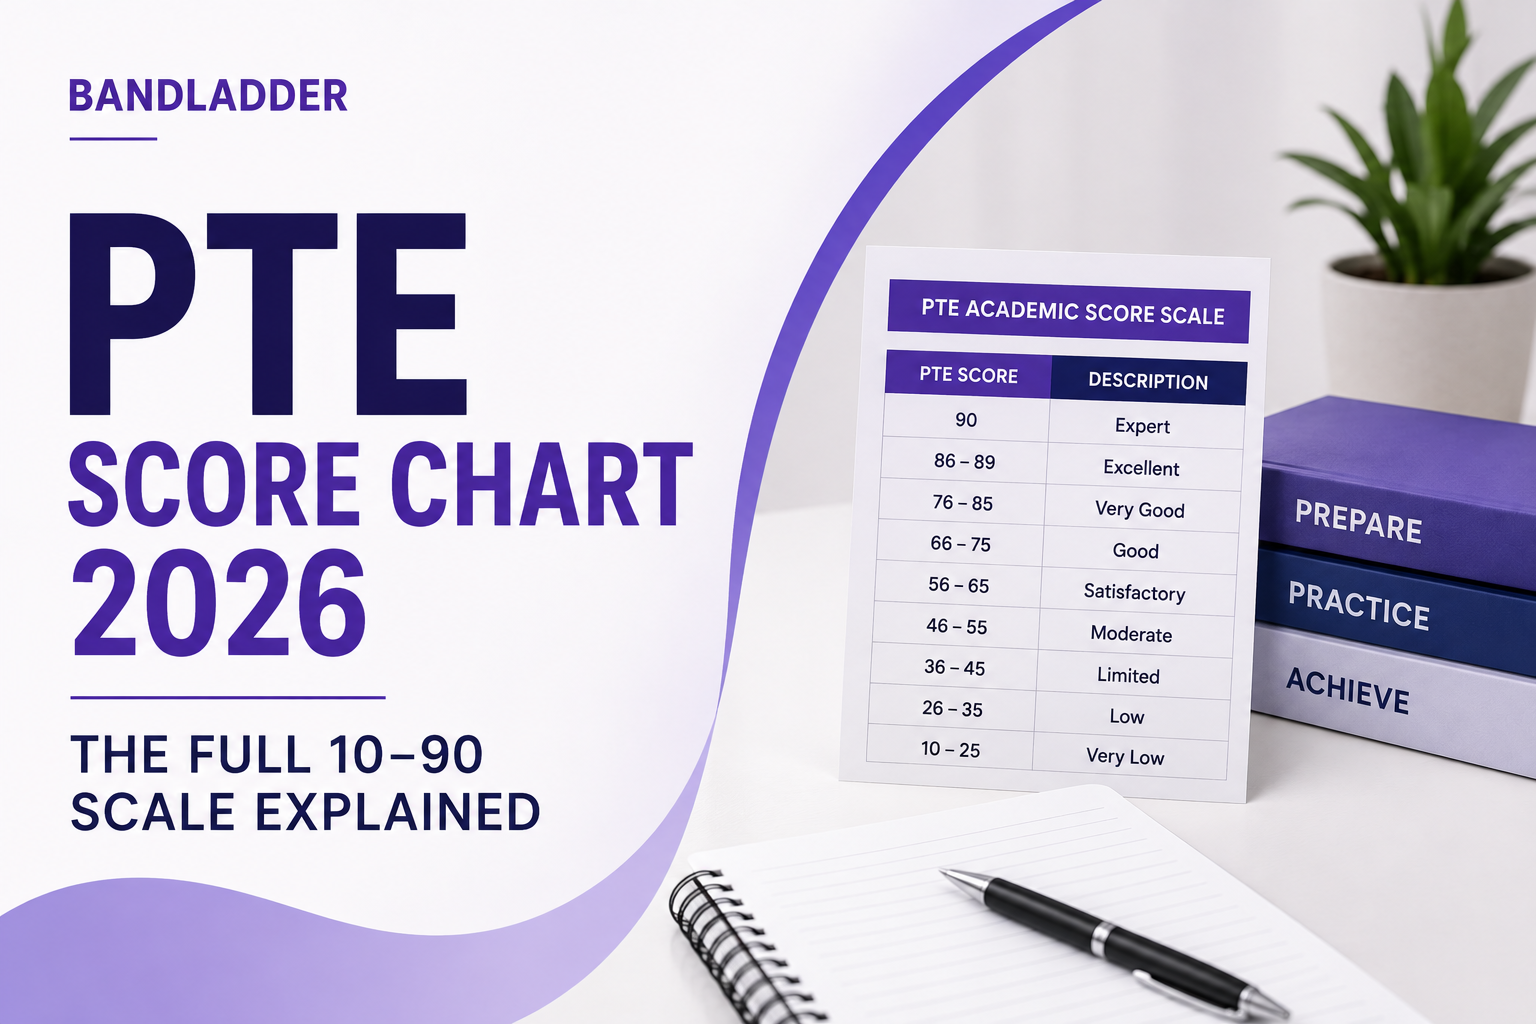
Official guidance checked: 20 September 2026. This is a score-report walkthrough. For score ranges and comparisons, use our PTE Academic score chart or the PTE-to-IELTS converter.
Score Report · Skills Profile · Worked example · Practice plan
What the overall and skill scores tell you
Pearson's Score Guide explains that the overall score reflects performance across the test and is not an average of Listening, Reading, Speaking and Writing. Integrated tasks can contribute to more than one skill. For example, Repeat Sentence assesses Listening and Speaking; that does not create a formula you can reconstruct from the four headline numbers.
Keep your report open beside the actual requirement. Make five separate comparisons: overall, Listening, Reading, Speaking and Writing. If the requirement does not specify one of these, record that accurately instead of inventing a threshold. Also check the test product, delivery format, date and any score-sharing instructions.
A mock result and an official result are different records. Label them clearly in your study notes so that a practice estimate is never accidentally entered as official application evidence.
What is the Skills Profile, and where did enabling skills go?
Pearson's report and profile explanation says the former Enabling Skills section was replaced in November 2021. The Skills Profile is for the test taker and is not shared with institutions. It groups feedback into eight areas:
- Open Response Speaking and Writing
- Reproducing Spoken and Written Language
- Extended Writing
- Short Writing
- Extended Speaking
- Short Speaking
- Multiple-skills Comprehension
- Single-skill Comprehension
The PTE Academic handbook explains how to open View Skills Profile from the online report and expand each area for its definition and recommendations.
Use those recommendations to form a practice question: “Do I lose the main idea in a longer response?” or “Do I omit words when reproducing a sentence?” Then inspect fresh answers. A broad profile category should not be treated as proof that one exact question caused a particular number of lost points.
Try it: turn a fictional report into a next step
Original fictional example: a learner needs 65 overall and at least 60 in each skill. Their report shows overall 66, Listening 64, Reading 63, Speaking 70 and Writing 58. Their Skills Profile suggests reviewing Extended Writing.
Which requirement is missed? Should they spend the next session trying to lift their strongest score, calculate a replacement overall score, or inspect a timed Writing response?
Reveal the diagnosis and a useful practice task
Writing is two points below the stated minimum. Overall and the other three skills meet these fictional conditions. Inspecting a timed Writing response is the relevant next step; another strong Speaking performance does not satisfy the missing Writing requirement.
Two-minute task: write a claim, a reason and one example answering: “Should universities provide more quiet study spaces?” Check that all three sentences address the same argument. This is a short planning drill, not a complete PTE essay or an official scored task.
Possible outline: universities should provide quiet spaces; shared accommodation can make concentration difficult; a student preparing a timed assignment could use a bookable silent room. Compare your own outline for relevance and logical connection, then practise a full timed response.
Build a practice plan from evidence
- Write the gap precisely. Record the required skill score and your latest official result. Put practice estimates in a separate column.
- Read the relevant profile advice. Choose one or two observations to investigate, rather than assuming that every low result has the same cause.
- Attempt a fresh task. For Writing, review whether the response addresses the prompt, develops a clear idea and uses accurate language. For Speaking, listen back for missing meaning and unclear delivery.
- Keep an error note. Record the task, the observed error and one correction you can test. “Improve Writing” is too broad; “explain how my example supports the claim” gives the next attempt a purpose.
- Recheck on different material. A better response to a memorised prompt is not enough evidence of transferable improvement. Use another prompt, then review the same feature.
Use the four-week PTE study plan to organise your sessions. If reproducing spoken information is the issue, the Repeat Sentence guide and Write From Dictation guide provide related task practice. Choose them because they address an observed gap, not because a generic weighting list promises an automatic score increase.
Is PTE marked only by AI?
No. Pearson's current scoring overview describes automated scoring with human expert review for some responses. Read the official task criteria instead of assuming that a memorised script or a particular speaking speed will guarantee marks.
Pearson also states in its test-update guidance that its own Scored Practice Tests use the official PTE scoring engine. BandLadder's AI feedback and practice scores are preparation tools, not Pearson score reports.
Continue with the skill you need
Start PTE Academic Writing practice for the worked example's skill gap, or continue with PTE Academic Speaking if that is your verified priority. Review feedback, record one change and test it in your next response.
BandLadder includes 25k+ PTE questions across Academic and Core and 30k+ IELTS questions, with feedback, mock-test and prediction resources. Free allowances and paid plans determine access. Track preparation progress without treating any practice result as a guaranteed official score.